
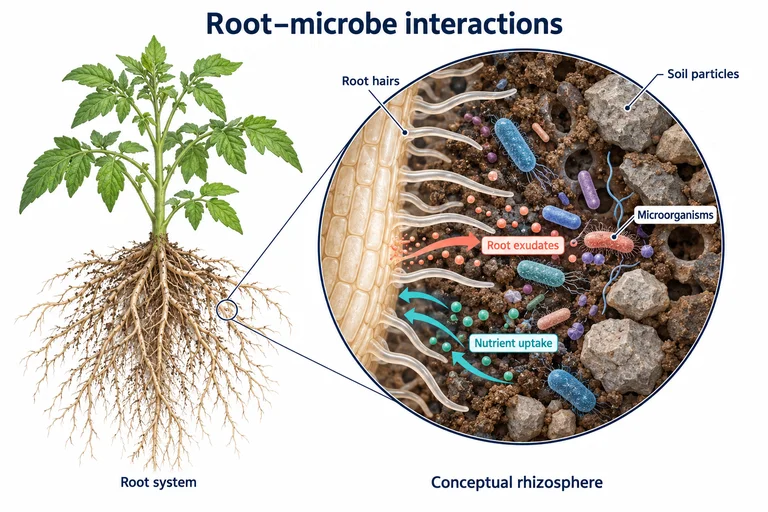
Root–microbe interactions
Zoom from roots into the rhizosphere and distinguish exchange directions.
Use this promptAgriculture & ecology Side-by-side comparison
Compare matched plants and connect leaf appearance to tissue detail.
Replace the example subjects, steps and findings with your research before generating.
Use the prompt to start with the example description, or use the image as a composition reference while keeping your own text.
Browsing and copying are free. Generation uses the credits shown in the maker.
Zoom from roots into the rhizosphere and distinguish exchange directions.
Use this prompt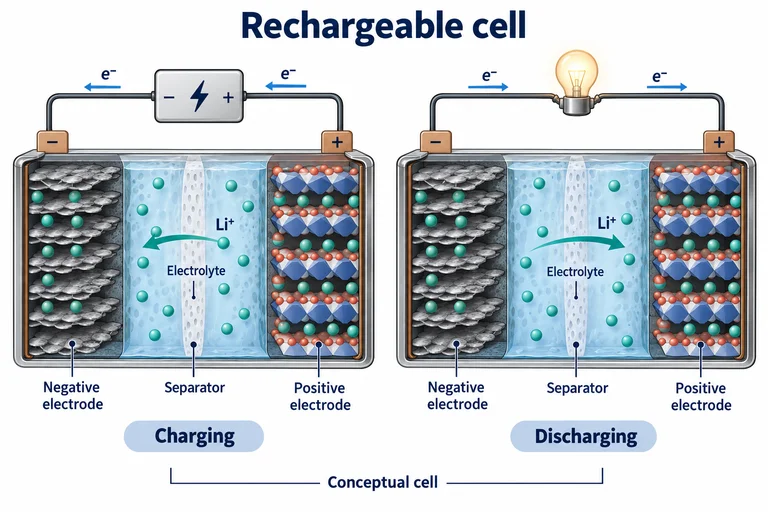
Compare ion transport and external electron flow across two states.
Use this prompt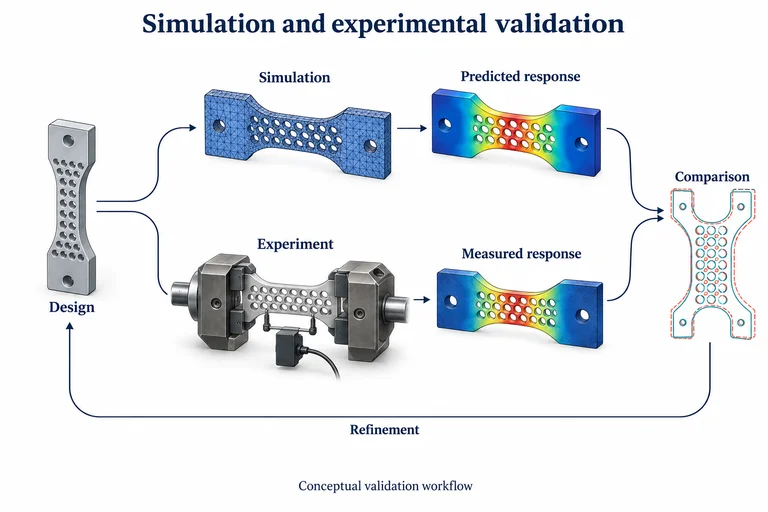
Branch one design into simulation and experiment, then compare.
Use this prompt